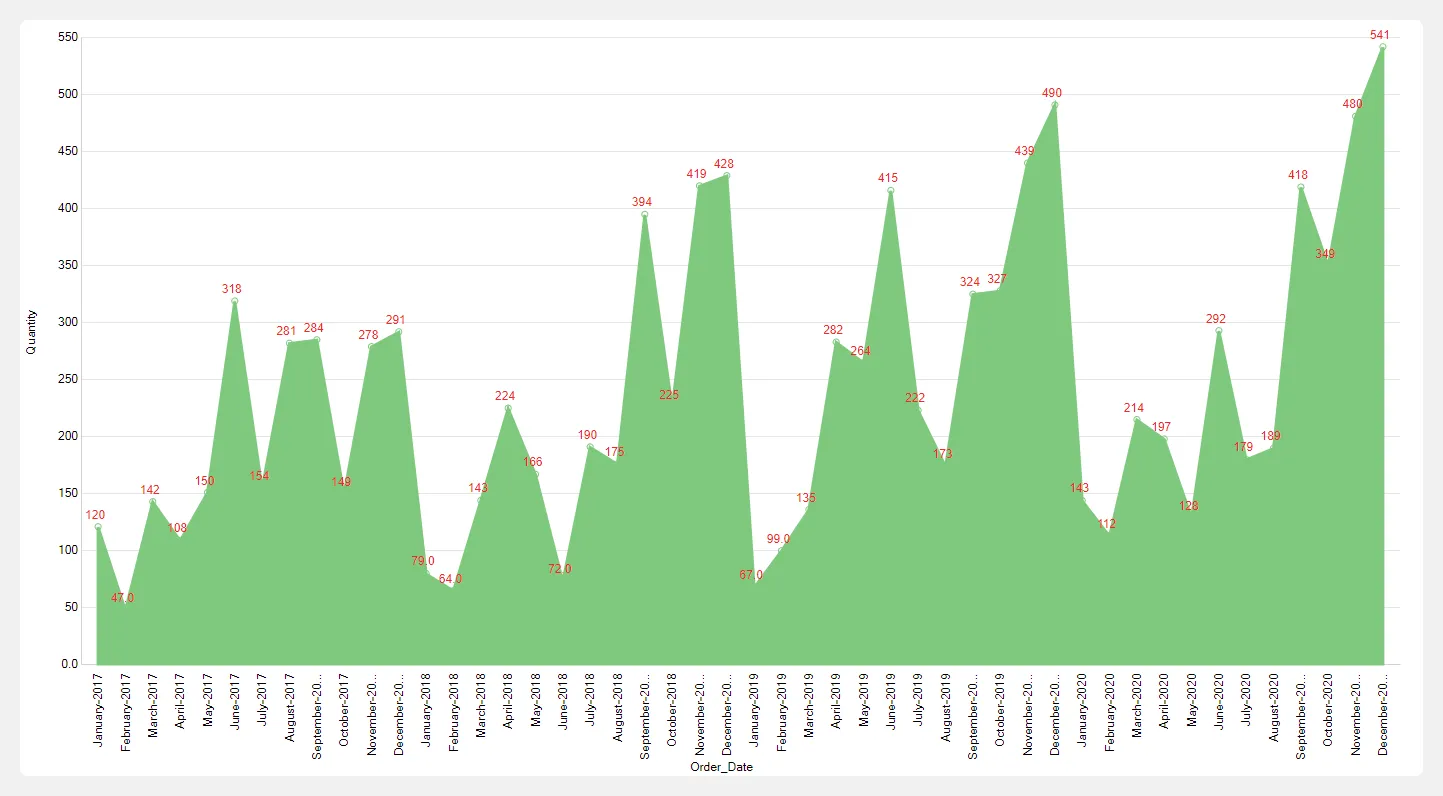
Area Chart
An Area Chart is a type of data visualization that displays quantitative data over time or across categories using shaded areas under a line. It is similar to a line chart but fills the area below the line, making it useful for showing trends and the magnitude of values over time while emphasizing the total value represented by the area.
Steps to area chart
Section titled “Steps to area chart”- Select the Area chart from the list of available charts.
- Drag and drop a categorical or date field into the X-Axis drop zone.
- Drag and drop a numerical field into the Y-Axis drop zone.
- Click the Get Result button to generate the chart.