KPI
KPI stands for Key Performance Indicator. In the context of data visuals, KPIs are quantifiable metrics that organizations use to evaluate their success in achieving specific objectives. KPIs provide valuable insights into performance and help stakeholders make informed decisions.
A KPI chart has two independent decisions behind it: which template it’s laid out in, and what it’s compared against, if anything. This article walks through both, including the option to show a single value with no comparison at all.
Steps to create KPI
Section titled “Steps to create KPI”Step 1: Add a KPI chart
Section titled “Step 1: Add a KPI chart”- From the chart type panel, click on KPI chart.
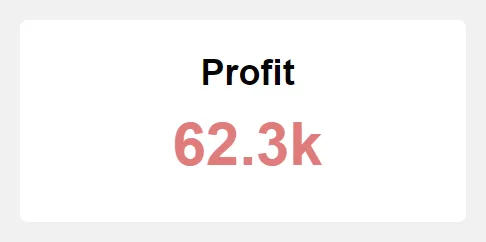
- Set the measure the card should track — for example, Sales.
Step 2: Choose a template
Section titled “Step 2: Choose a template”- Click on Format tab.
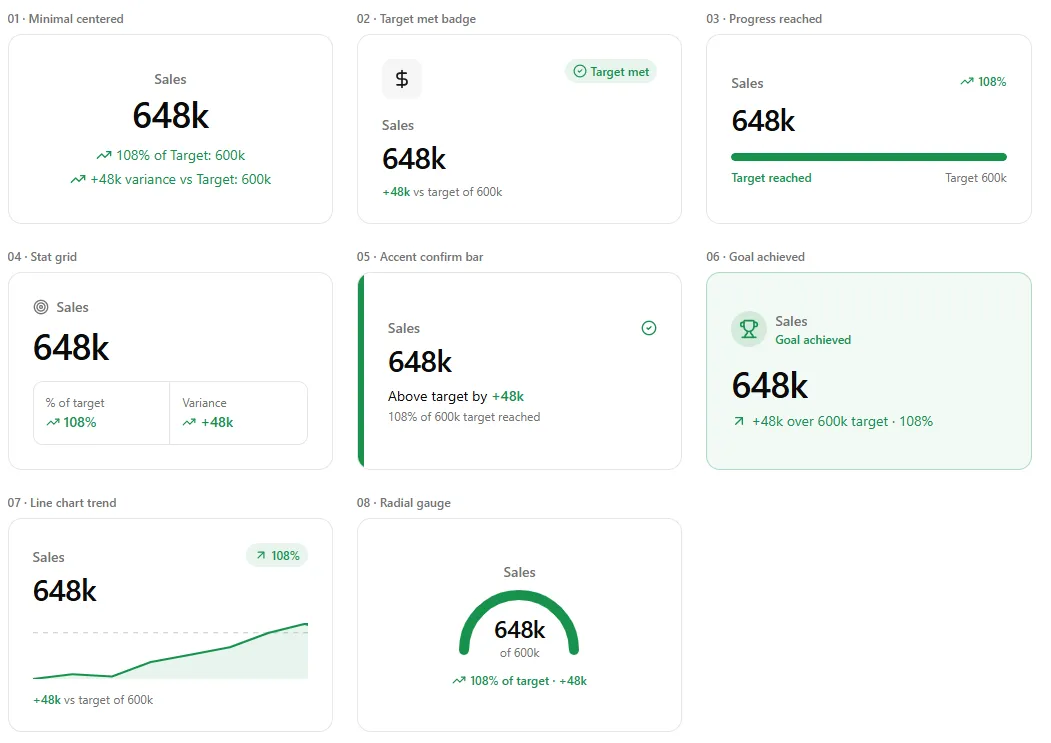
- From layout panel, choose template to see all available layouts. Each preview below uses the same sample value (Sales = 648k, target = 600k) so you can compare styles directly.
Step 2: Set the comparison value
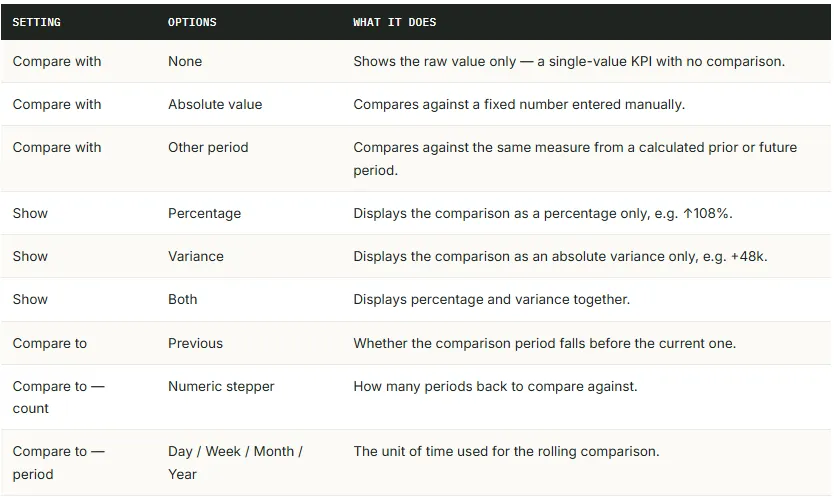
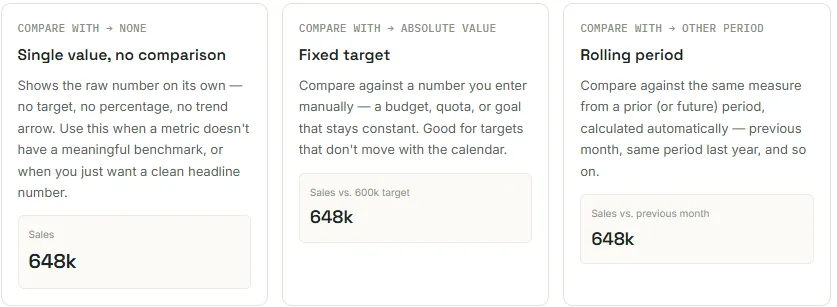
Section titled “Step 2: Set the comparison value”Open the Comparison value panel in the KPI chart’s format settings. Start by choosing what, if anything, to compare the value with
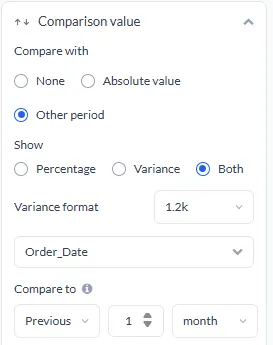
This is the Compare with setting.
When Compare with is Absolute value or Other period
Section titled “When Compare with is Absolute value or Other period”Two more settings become available:
Show — display the comparison as Percentage, Variance, or Both. If Variance or Both is chosen, also pick a Variance format (e.g. 1.2k) to control how the number is abbreviated.
When Compare with is Other period
Section titled “When Compare with is Other period”Configure the rolling window under Compare to:
- Select the date field the comparison is based on, e.g. Order_Date.
- Choose a direction: in current version only Previous option is available.
- Enter a number of periods to offset by, e.g. 1, 2, 3 …
- Choose the period type: Day, Week, Month, or Year.
Settings reference
Section titled “Settings reference”