Running Total
Running Total calculates a cumulative value across the data points in your visualization. Instead of showing the value for each point independently, it adds each value to the total from the preceding points.
Running Total is available on:
- Bar charts
- Line charts
- Area charts
- Combination charts
- Tables
- Pivot tables
Example, if monthly sales are:
| Month | Sales | Running Total |
|---|---|---|
| January | €10,000 | €10,000 |
| February | €15,000 | €25,000 |
| March | €12,000 | €37,000 |
| April | €18,000 | €55,000 |
The running total for each month includes the values from that month and all preceding months.
Enable Running Total
Section titled “Enable Running Total”- Add a measure to your visualization.
- Open the Analytics tab.
- Find Running Total.
- Turn on Show running total.
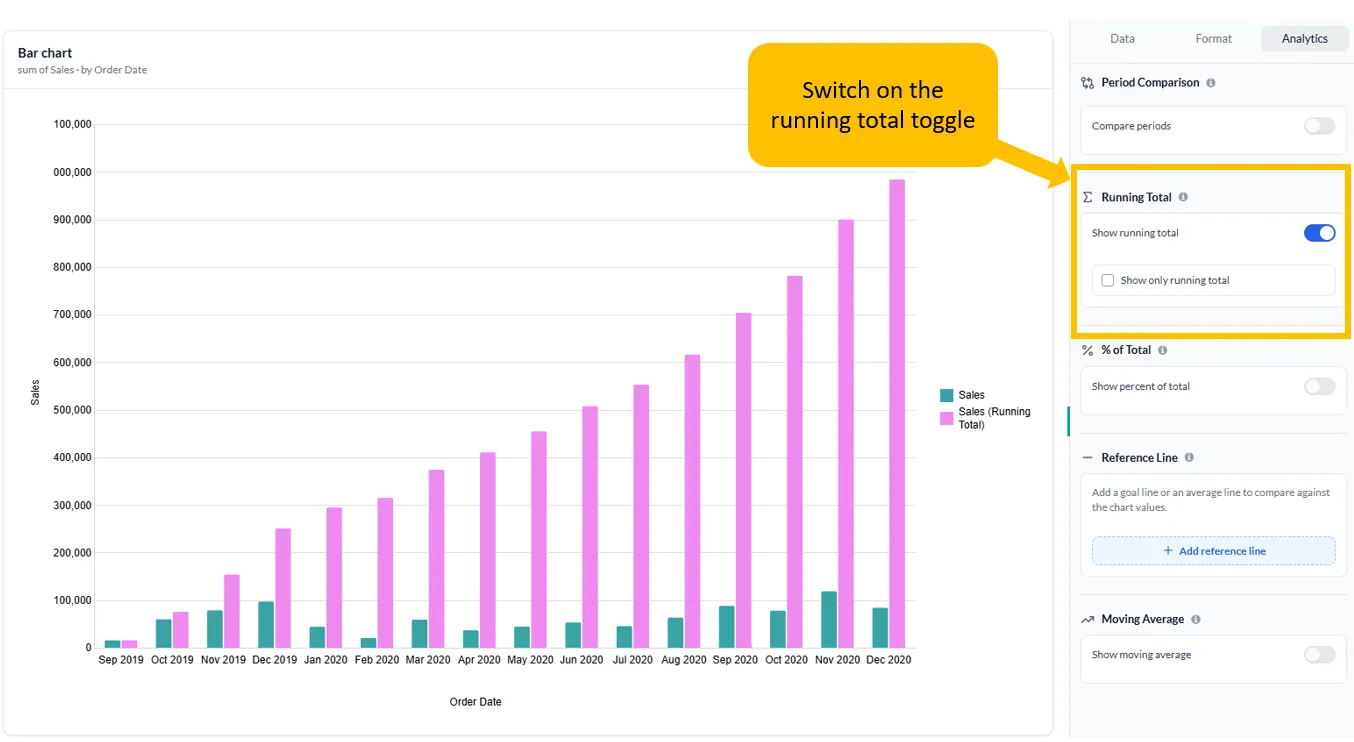
The visualization will display the cumulative value alongside the original measure.
Show only the running total
Section titled “Show only the running total”By default, enabling Show running total keeps the original measure and adds the running total.
To display only the cumulative value:
- Turn on Show running total.
- Select Show only running total.
When this option is selected, the original measure is replaced by its running total in the visualization.
How the running total is calculated
Section titled “How the running total is calculated”The running total is calculated sequentially according to the order of the data points in the visualization.
For example:
Running Total = Current Value + All Previous ValuesFor monthly revenue:
January = JanuaryFebruary = January + FebruaryMarch = January + February + MarchApril = January + February + March + AprilHow the running total is calculated in Pivot
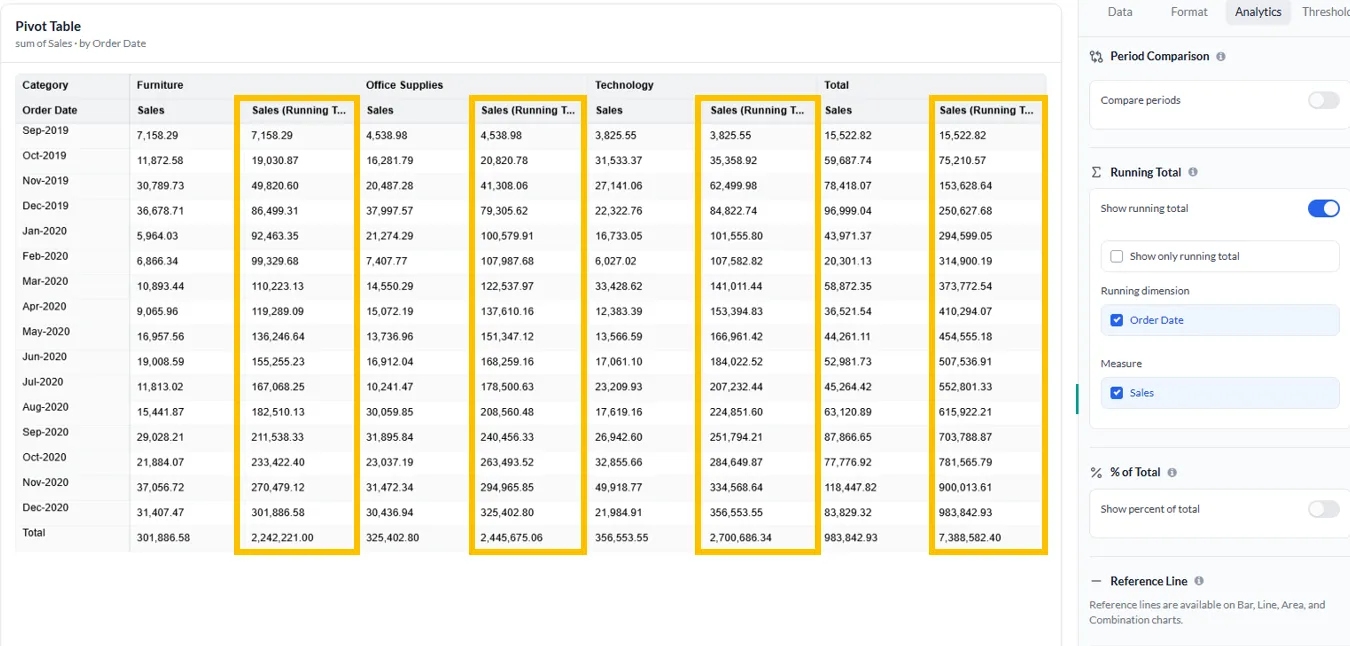
Section titled “How the running total is calculated in Pivot”A Running Total accumulates values along the date axis and is calculated separately for each combination of the other (non-date) dimensions in the pivot. When the non-date dimension changes, the running total resets and starts again from zero.
Example: Your pivot contains Date (grouped by month-year), Category, and Sum of sales. The running total adds up month-year within each category, then restarts when it reaches the next category.