
Chart customization and formatting
Chart customization is very easy in Grafieks and can be done from the Format pane of the Chart designer page.
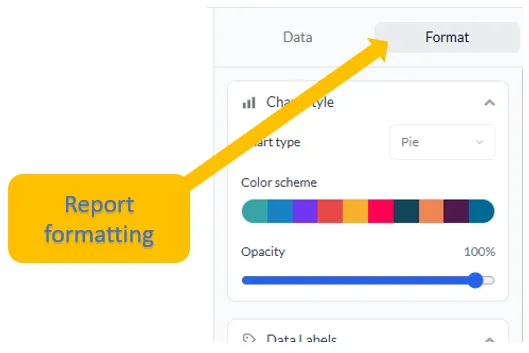
The Chart Formatting panel allows users to customize the appearance and readability of Charts. These formatting options are available both in the Data Exploration page and directly on the Dashboard Designer canvas page, allowing users to format visualizations while designing or editing a dashboard.
The available formatting options vary depending on the Chart type. Charts that use axes provide dedicated X-axis and Y-axis formatting controls, while Charts that do not use axes, such as pie and radar format panel only display formatting options relevant to chart type.
The available formatting properties can be used to configure options such as:
- Chart style and appearance
- Data labels
- Axis properties, where applicable
- Gridlines
- Legend
- Font properties
- Colors and other visual settings
The formatting options shown are context-sensitive and depend on the selected Chart type.
Chart Style
Section titled “Chart Style”The Chart Style section controls the overall appearance of the Chart.
Depending on the Chart type, users can configure:
- Viewport – Choose whether the axis-based Chart should fit within the available space or support scrolling.
- Bar Color – Customize the color of bars in bar-based Charts.
- Bar Width – Adjust the width of individual bars.
- Corner Radius – Control the roundness of bar corners.
- Opacity – Adjust the transparency of Chart elements.
Data Labels
Section titled “Data Labels”The Data Labels section controls how values are displayed directly on Chart elements.
Users can configure:
- Show Value Labels – Display or hide values on the Chart.
- Number Format – Choose how numerical values are represented.
- Position – Define where labels appear in relation to Chart elements.
- Font Family – Select the font used for labels.
- Font Size – Adjust label text size.
- Bold and Italic – Apply text emphasis.
- Font Color – Customize the label color.
The Axes section is available for axis-based Charts. It provides separate formatting controls for the X-axis and Y-axis.
X-Axis
Section titled “X-Axis”Users can configure:
- Show Axis
- Name
- Font Family
- Font Size
- Text Decoration
- Font Color
- Tick Mark Properties
- Axis Line
- Line Style
- Line Color
Y-Axis
Section titled “Y-Axis”The Y-axis provides equivalent formatting controls for the vertical axis:
- Show Axis
- Axis Name
- Font Family
- Font Size
- Text Decoration
- Font Color
- Tick Mark Properties
- Axis Line Visibility
- Line Style
- Line Color
These controls help users maintain a consistent presentation and improve Chart readability.
Gridlines
Section titled “Gridlines”The Gridlines section controls the reference lines displayed across the Chart.
Available options include:
- Show Gridlines
- Line Style
- Line Width
- Line Color
Gridlines can make it easier to compare values across the Chart.
Legend
Section titled “Legend”The Legend section controls the display and appearance of the Chart legend.
Users can configure:
- Show Legend
- Position
- Font Family
- Font Size
- Text Decoration
- Font Color
A legend is particularly useful when a Chart contains multiple series or categories.
Axis-Based vs. Non-Axis-Based Charts
Section titled “Axis-Based vs. Non-Axis-Based Charts”The formatting panel adapts to the selected visualization because not every Chart uses traditional X and Y axes.
Axis-Based Charts
Section titled “Axis-Based Charts”Charts that use horizontal and vertical axes, such as bar, area, line, and similar Charts provide axis-related formatting options. Users can customize the X-axis, Y-axis, tick marks, axis lines, and other axis-specific properties.
Non-Axis-Based Charts
Section titled “Non-Axis-Based Charts”Charts that do not rely on traditional axes, such as pie and radar Charts do not display X-axis and Y-axis formatting options.
Instead, users can configure the properties relevant to those visualizations, such as:
- Data labels
- Legend
- Other Chart-specific appearance settings
This ensures that the formatting panel displays only the settings that are applicable to the selected Chart.
Key Takeaway
Section titled “Key Takeaway”Chart formatting can be performed directly in the Dashboard Designer canvas page, making it easy to customize a visualization while building a dashboard.
The formatting options are context-sensitive: axis-based Charts provide X-axis and Y-axis formatting, while non-axis-based Charts such as pie and radar Charts do not include axis formatting. This keeps the configuration experience focused on the properties that are relevant to each visualization.