
Funnel Chart
The Funnel Chart Templates feature allows users to customize the appearance and layout of funnel charts in the BI platform. Users can choose from multiple predefined funnel designs to best represent their data and improve visualization clarity.
Funnel templates provide different visual styles while maintaining the same underlying data representation. The selected template changes only the chart appearance and does not affect the data, calculations, or metrics.
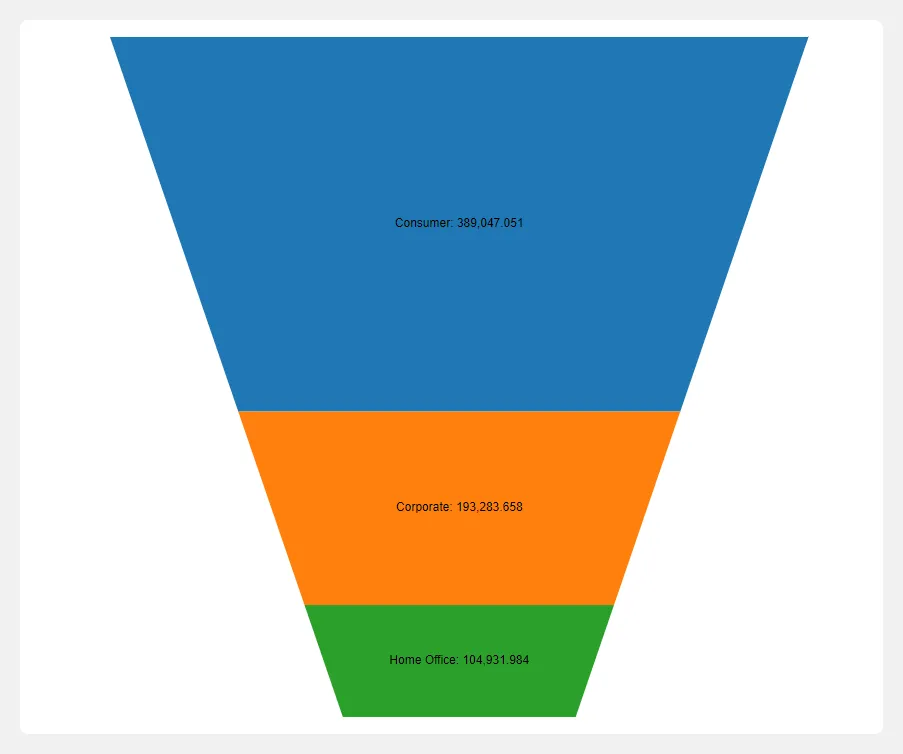
Steps to create funnel chart
Section titled “Steps to create funnel chart”Step 1: Create funnel chart
Section titled “Step 1: Create funnel chart”- From the chart type panel, click on Funnel chart.
- In the “Data” tab, drag and drop a categorical field and a numerical field from data panel.
Step 2: Choose a template
Section titled “Step 2: Choose a template”- In the “Format” tab, navigate to layout and click on “Choose Template”.
- Select a preferred funnel template from the available options.
The chart preview updates immediately after selecting a template.
Available Funnel Templates
Section titled “Available Funnel Templates”The BI tool currently supports the following funnel designs:
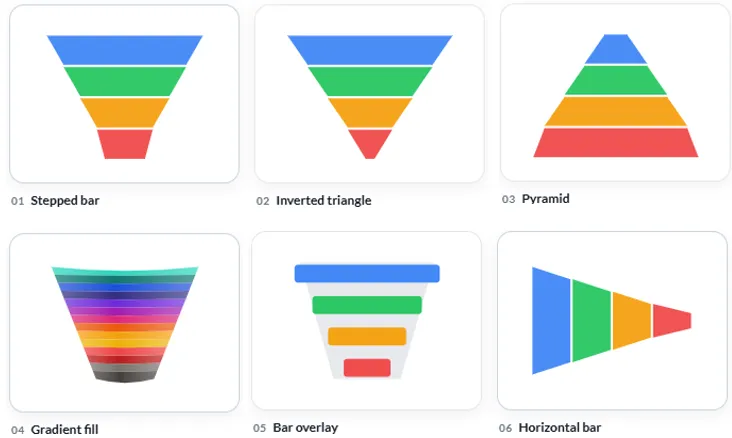
01. Stepped Bar
Section titled “01. Stepped Bar”Description: The Stepped Bar funnel displays each stage as a horizontal section with decreasing width. Each stage has a clear boundary, making it easy to compare values between steps.
Best suited for:
- Sales pipelines
- Conversion funnels
- Process tracking
- Customer journeys
- Example use case:
A sales team tracking:
| Stage | Customers |
|---|---|
| Leads | 10,000 |
| Qualified Leads | 6,000 |
| Opportunities | 3,000 |
| Closed Deals | 1,000 |
02. Inverted Triangle
Section titled “02. Inverted Triangle”Description: The Inverted Triangle template represents a traditional funnel shape where each stage narrows toward the bottom.
Best suited for:
- Classic funnel reporting
- Executive dashboards
- Marketing conversion analysis
Benefits:
- Familiar funnel representation
- Easy interpretation of drop-off between stages
- Clean presentation style
03. Pyramid
Section titled “03. Pyramid”Description: The Pyramid template displays stages as stacked levels that expand downward.
Best suited for:
- Hierarchical analysis
- Segmentation views
- Layered business processes
Benefits:
- Highlights progression through levels
- Useful when each stage represents increasing depth or importance
04. Gradient Fill
Section titled “04. Gradient Fill”Description: The Gradient Fill template uses smooth color transitions between funnel stages.
Best suited for:
- Modern dashboards
- Presentation reports
- Visual storytelling
Benefits:
- Provides a visually rich appearance
- Helps distinguish multiple funnel stages
05. Bar Overlay
Section titled “05. Bar Overlay”Description: The Bar Overlay template combines funnel sections with proportional bar-style visualization.
Best suited for:
- Detailed comparisons
- Analytical dashboards
- Users who prefer bar chart readability
Benefits:
- Combines funnel structure with bar visualization
- Makes value differences easier to compare
06. Horizontal Bar
Section titled “06. Horizontal Bar”Description: The Horizontal Bar template rotates the funnel orientation and displays stages from left to right.
Best suited for:
- Wide dashboards
- Timeline-style processes
- Limited vertical space layouts
Benefits:
- Uses horizontal screen space efficiently
- Easier viewing for large labels
Choosing the Right Funnel Template
Section titled “Choosing the Right Funnel Template”| Template | Recommended For | Visual Style |
|---|---|---|
| Stepped Bar | Sales pipelines, conversions | Traditional funnel |
| Inverted Triangle | Executive reporting | Classic funnel |
| Pyramid | Hierarchies and layers | Structured levels |
| Gradient Fill | Presentations and dashboards | Modern visual |
| Bar Overlay | Detailed analysis | Funnel + bar comparison |
| Horizontal Bar | Wide layouts | Left-to-right flow |
Customizing Funnel Appearance
Section titled “Customizing Funnel Appearance”After selecting a template, users can further customize:
Color Scheme
Section titled “Color Scheme”Change the colors applied to funnel stages.
Options may include:
- Category-based colors
- Custom color palettes
Opacity
Section titled “Opacity”Controls the transparency level of funnel sections.
Higher opacity:
- Stronger visual emphasis
- Better visibility
Lower opacity:
- Softer appearance
- Better dashboard integration
Dynamic Height
Section titled “Dynamic Height”Controls whether funnel stage heights automatically adjust based on values.
Enabled:
- Larger values receive more visual space
- Emphasizes differences between stages
Disabled:
- All stages have equal height
- Focuses attention on stage names rather than magnitude
Data Labels
Section titled “Data Labels”Users can configure how information appears inside the funnel.
Available options include:
- Show/hide value labels
- Adjust label position
- Change number format
- Modify font family
- Adjust font size
- Apply bold or italic formatting
Summary
Section titled “Summary”Funnel Chart Templates provide flexible visualization options for representing sequential stages such as sales pipelines, customer journeys, and conversion processes. Users can choose from six layouts: Stepped Bar, Inverted Triangle, Pyramid, Gradient Fill, Bar Overlay, and Horizontal Bar and customize colors, labels, and formatting to create effective business reports.