
Percentage of Total
Percentage of Total shows each value as a percentage of a selected total. It helps you understand how much each value contributes to the overall total or to a total defined by specific dimensions.
Percentage of Total is available on:
- Bar charts
- Line charts
- Area charts
- Combination charts
- Tables
- Pivot tables
Note: For the best presentation of your analysis, we recommend using it in a table or a pivot table.
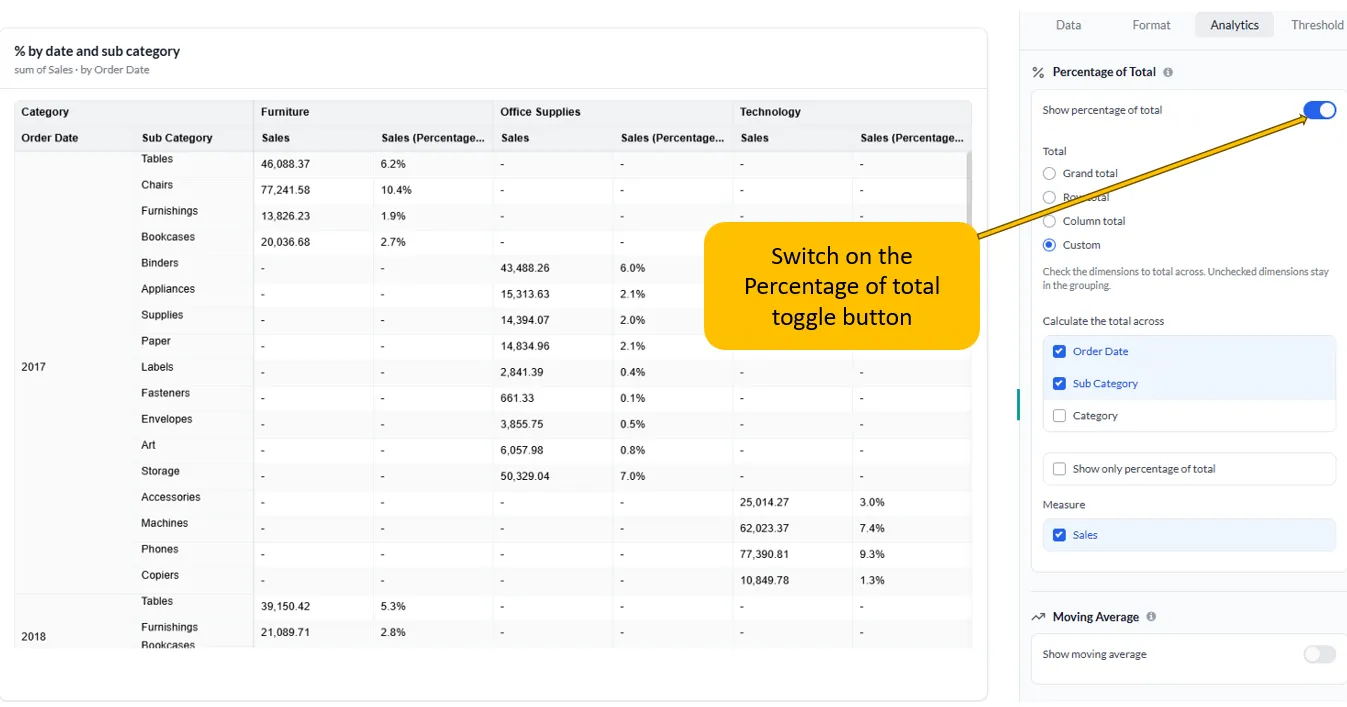
How Percentage of Total works
Section titled “How Percentage of Total works”When you enable Show percentage of total, each value is divided by the applicable total and expressed as a percentage.
For example, if total sales are €100,000 and a category has €25,000 in sales:
€25,000 ÷ €100,000 × 100 = 25%The category therefore represents 25% of the total sales.
In a Table, Percentage of Total is applied to the selected measure column. You can also control how the total is calculated by selecting the dimensions to total across.
Enable Percentage of Total
Section titled “Enable Percentage of Total”- Create a supported visualization and add a measure.
- Open the Analytics tab.
- Find Percentage of Total.
- Turn on Show percentage of total.
- Choose the type of total:
- Grand total
- Custom
- If you select Custom, choose the dimensions to include in the total calculation.
- Optionally select Show only percentage of total.
Choose the total
Section titled “Choose the total”The Total setting determines the denominator used to calculate each percentage.
Grand total
Section titled “Grand total”Select Grand total to calculate each value against the overall total of the measure.
| Category | Sales | % of Total |
|---|---|---|
| Electronics | €50K | 50% |
| Furniture | €30K | 30% |
| Clothing | €20K | 20% |
| Total | €100K | 100% |
The percentage is calculated as:
% of Total = Value ÷ Grand Total × 100Custom total
Section titled “Custom total”Select Custom when you want to control which dimensions are included when calculating the total.
When Custom is selected, the Calculate the total across section appears. Select the dimensions that should be used to calculate the total.
For example, suppose a table contains:
- Order Date
- Category
- Sales
You can select Order Date and Category under Calculate the total across.
Selected dimensions
Section titled “Selected dimensions”A selected dimension is included when calculating the total.
Unselected dimensions
Section titled “Unselected dimensions”An unselected dimension remains part of the grouping.
This allows you to calculate percentages at different levels of your data rather than always using one grand total.
Example: Custom total by dimensions
Section titled “Example: Custom total by dimensions”Suppose your table contains sales by Order Date and Category:
| Order Date | Category | Sales |
|---|---|---|
| Jan | Electronics | €40K |
| Jan | Furniture | €60K |
| Feb | Electronics | €30K |
| Feb | Furniture | €70K |
If Order Date and Category are selected under Calculate the total across, the total is calculated across those dimensions according to the table’s grouping.
The resulting percentage is based on the corresponding total defined by those selected dimensions.
This is useful when you want to answer questions such as:
- What percentage of sales does each category represent?
- What percentage of sales does each date represent?
- What percentage does a value represent within a combination of dimensions?
Percentage of Total in a Table
Section titled “Percentage of Total in a Table”In a Table, Percentage of Total works on the measure column.
For example, if your table contains a Sales column, enabling Percentage of Total calculates the percentage for the Sales values.
You can use Custom to control the dimensions used to calculate the total for that column.
For example:
| Order Date | Category | Sales | % of Total |
|---|---|---|---|
| Jan | Electronics | €40K | 40% |
| Jan | Furniture | €60K | 60% |
| Feb | Electronics | €30K | 30% |
| Feb | Furniture | €70K | 70% |
The exact percentages depend on which dimensions are selected under Calculate the total across.
Show only percentage of total
Section titled “Show only percentage of total”By default, Show only percentage of total is unchecked. This allows the original measure and its percentage to be displayed.
Select Show only percentage of total when you want to display the percentage instead of the original measure.
For example:
Without Show only percentage of total
| Category | Sales | % of Total |
|---|---|---|
| Electronics | €50K | 50% |
| Furniture | €30K | 30% |
With Show only percentage of total
| Category | % of Total |
|---|---|
| Electronics | 50% |
| Furniture | 30% |
Measure
Section titled “Measure”The Measure section determines which measure is used to calculate the percentage.
For example, if Sales is selected:
Percentage of Total = Sales Value ÷ Applicable Sales Total × 100This allows Percentage of Total to be applied to the measure that is relevant to your analysis.
Tips for using Percentage of Total
Section titled “Tips for using Percentage of Total”- Use Grand total when you want values compared with the overall measure total.
- Use Custom when the percentage needs to be calculated within a specific dimensional context.
- In a Table, the calculation is applied to the selected measure column.
- Under Custom, select the dimensions you want to include in Calculate the total across.
- Remember that unchecked dimensions remain in the grouping.
- Use Show only percentage of total when you want to hide the original measure and display only the percentage.
- Use Percentage of Total to analyze sales mix, revenue contribution, category distribution, and other part-to-whole relationships.