Bar Chart
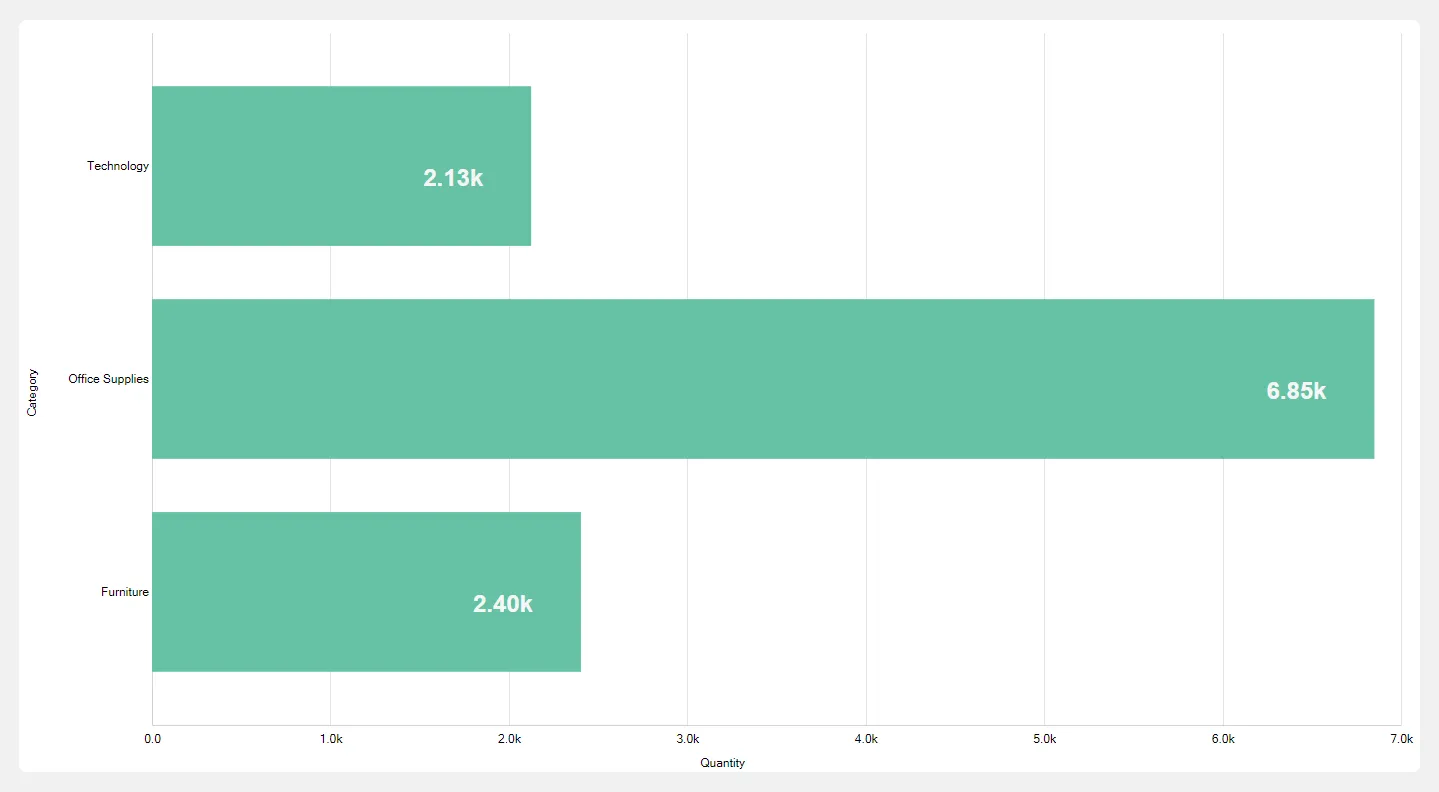
A bar chart (or bar graph) is a type of chart that uses rectangular bars to represent data values in horizontal bars. The length of each bar is proportional to the value it represents, making it easy to compare different categories or groups. For instance, a bar chart can represent the sales performance of various products, with each bar indicating the sales volume or revenue for each item. They are also effective in showcasing survey outcomes, comparing market shares, visualizing budget distributions, and illustrating population demographics, offering a straightforward and intuitive way to interpret the data visually.
Steps to create bar chart
Section titled “Steps to create bar chart”- Select the Bar chart from the list of available charts.
- Drag and drop a categorical or date field into the Y-Axis drop zone.
- Drag and drop a numerical field into the X-Axis drop zone.
- Click the Get Result button to generate the chart.