Column Chart
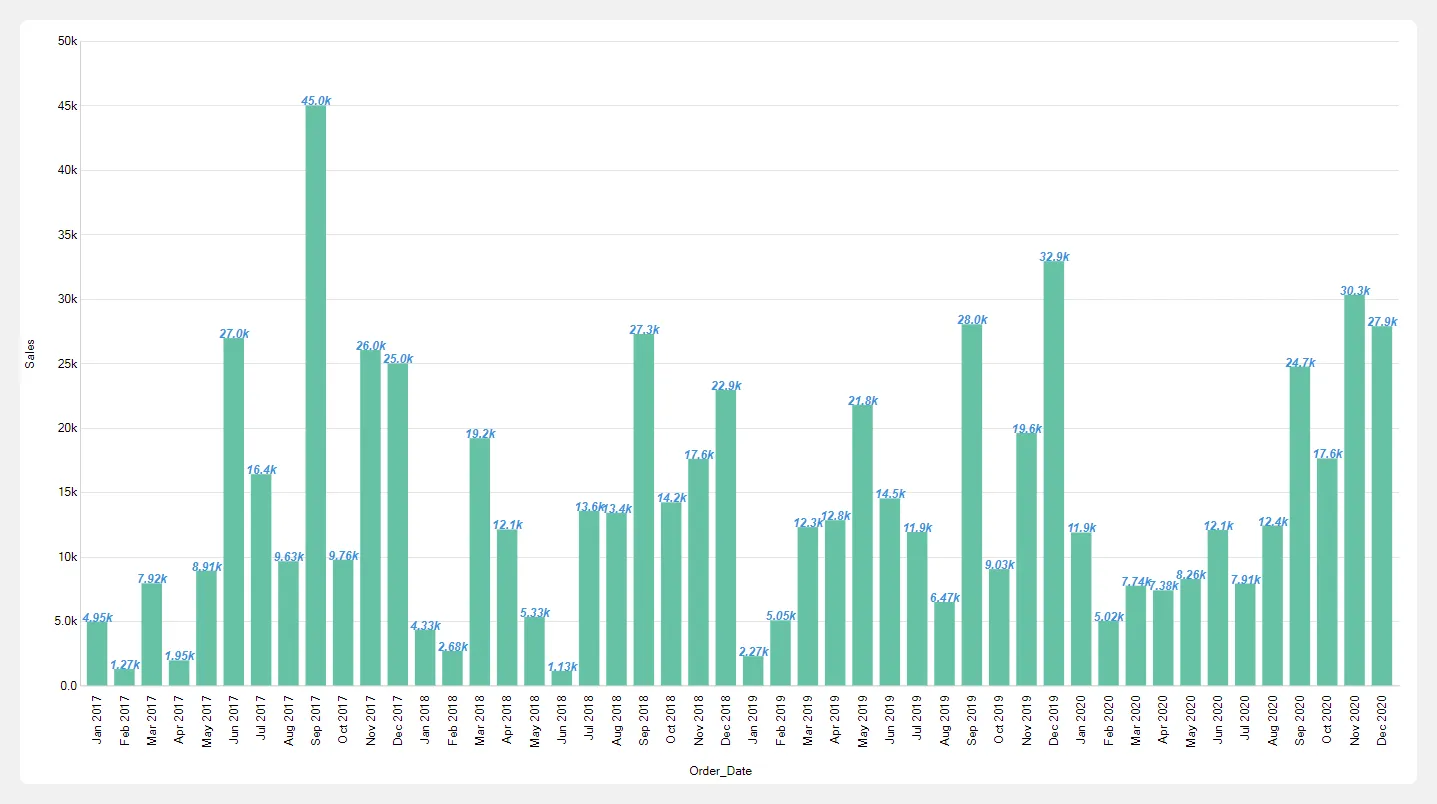
Column charts visually represent categorical or quantitative data using vertical bars, making it easy to compare values across different categories. They are frequently used to highlight trends, make comparisons, and show distributions. For instance, a column chart can display the monthly sales of various products, with each bar reflecting the revenue for a particular month.
Steps to create column chart
Section titled “Steps to create column chart”- Select the Column chart from the list of available charts.
- Drag and drop a categorical or date field into the X-Axis drop zone.
- Drag and drop a numerical field into the Y-Axis drop zone.
- Click the Get Result button to generate the chart.