Combination Chart
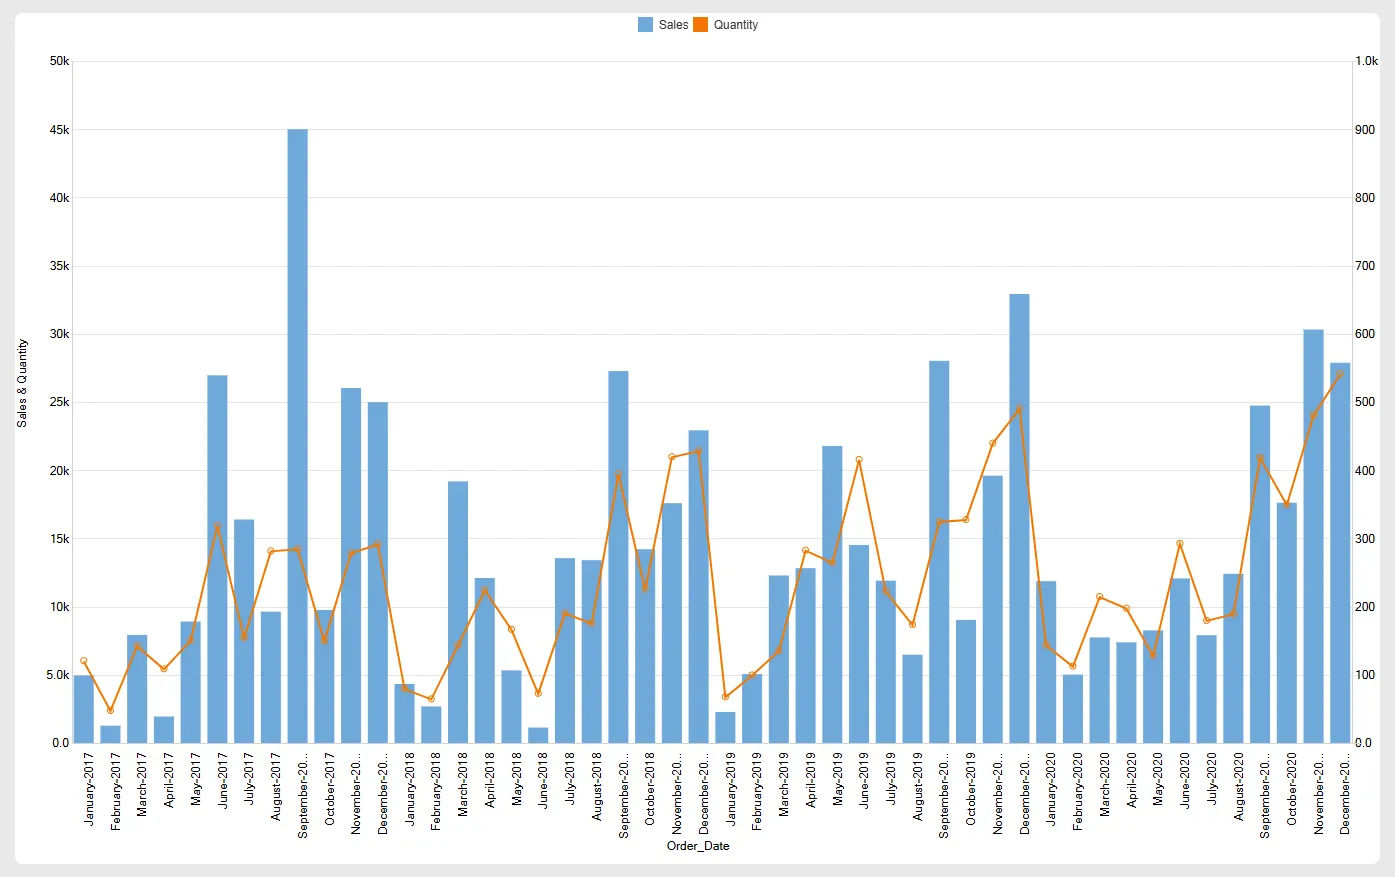
A Combination Chart is a data visualization tool that displays multiple types of charts—such as bar, line, or area—in a single view to represent different data sets or metrics. It helps compare and analyze diverse data series with varying scales or units. For example, a line graph might show sales trends over time while a bar chart illustrates monthly revenue. This chart type enhances clarity by integrating multiple insights into one cohesive graphic, making it ideal for identifying relationships, trends, and anomalies.
Steps to create combination chart
Section titled “Steps to create combination chart”- Select combination chart from the list of charts
- Drag and drop either a categorical or a date field onto X-Axis drop zone.
- Drag any numerical field to the Y-Axis drop zone. You may add multiple fields for comparison.
- Click on Get Result button
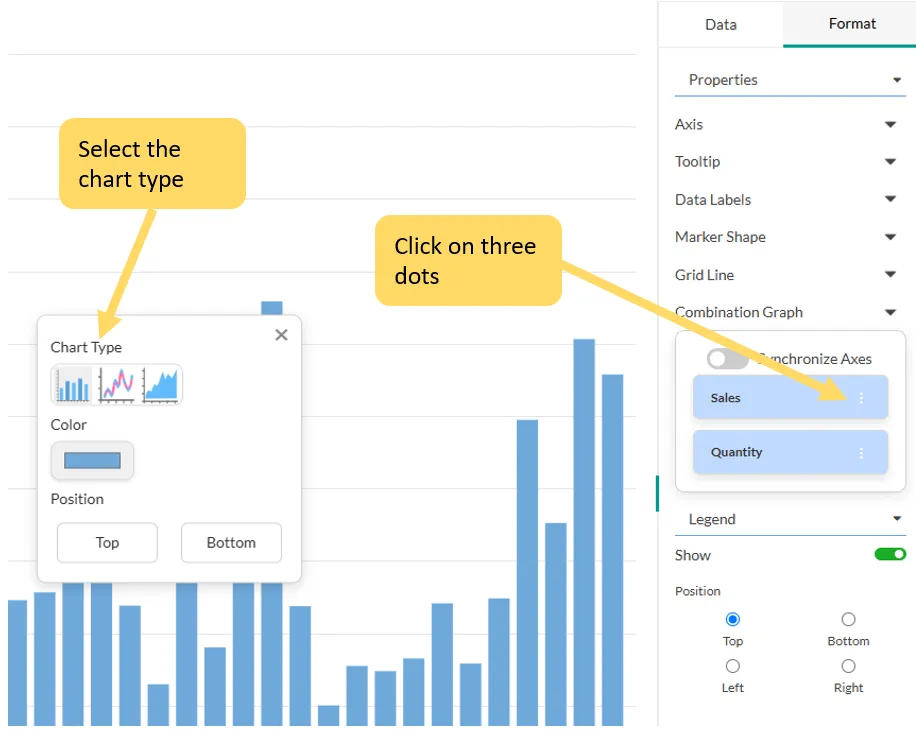
Steps to change the type of chart
Section titled “Steps to change the type of chart”- Navigate to the Format tab to change the chart type.
- Select Combination Chart from the available options.
- Locate the numerical fields in the list and click the three dots (⋯) next to the desired field.
- In the modal that appears, choose the chart type and set the desired color.
- To adjust the chart’s position, select either Top or Bottom.