Donut Chart
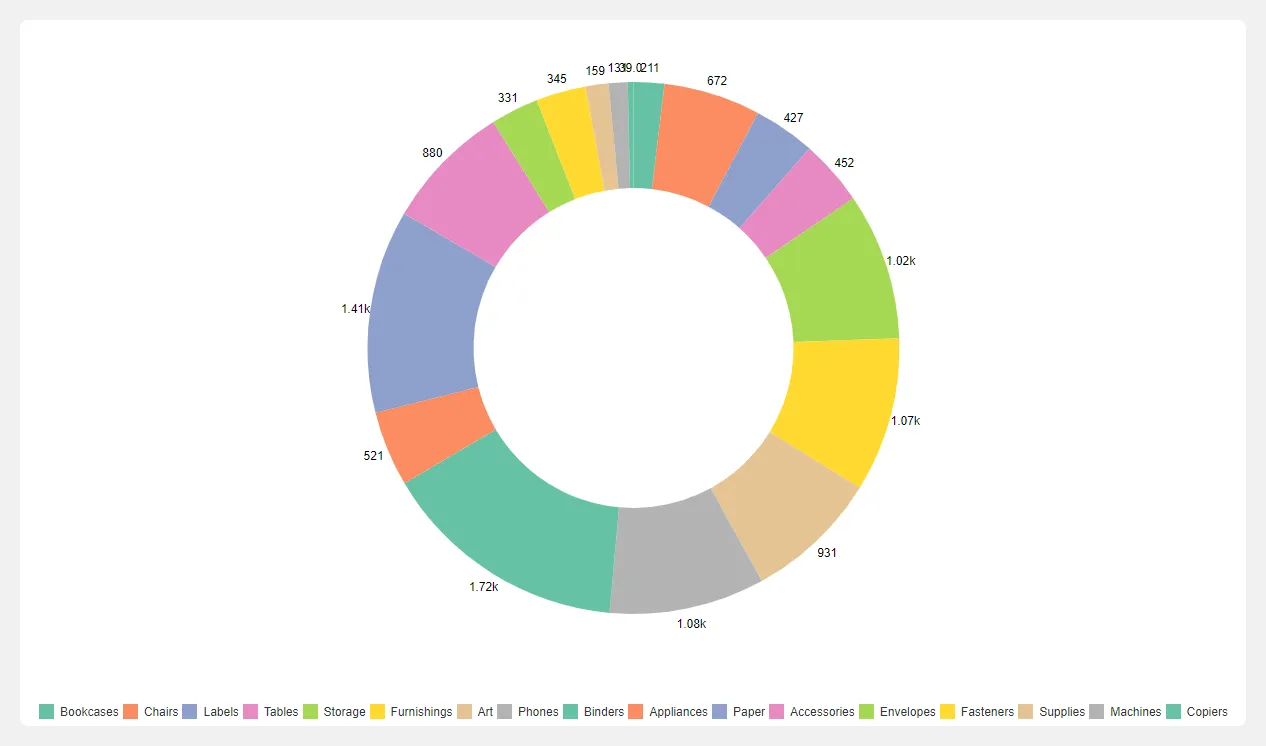
A donut chart is a type of circular statistical graphic that resembles a pie chart but has a hollow center, creating a “donut” shape. Like pie charts, donut charts are used to represent proportions of a whole, with each segment or “slice” showing the contribution of each category to the total. The hollow center can also be used to display additional information or context.
Steps to create donut chart
Section titled “Steps to create donut chart”- Select the Donut Chart from the list of available charts.
- Drag and drop a categorical or date field into the Categorical drop zone.
- Drag and drop a numerical field into the Numerical drop zone.
- Click the Get Result button to generate the chart.