Geo Chart Introduction
A Geo Chart in a data visualization tool is used to display information on a map, making it easier to analyze geographic trends and distributions. It represents data using colors, markers, or bubbles over a world map or specific regions, helping users compare statistics such as population density, economic indicators, or sales performance across different locations. Geo charts are widely used in business intelligence, market research, and demographic studies, providing clear insights into spatial relationships and patterns. With interactive features, users can zoom in, filter data, and hover over regions for more details, enhancing data exploration and decision-making.
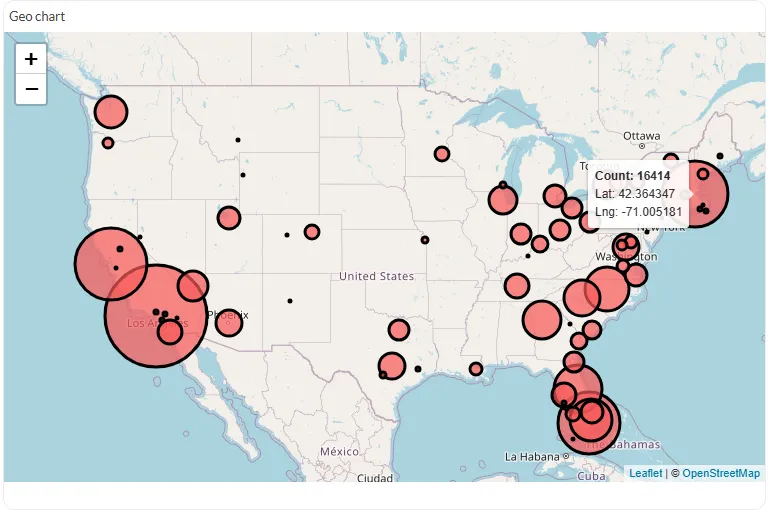
In this release, only the geo bubble chart is available for visualization. The Filled Geo Chart and Connection Chart will be introduced in future updates.