Grouped Column Chart
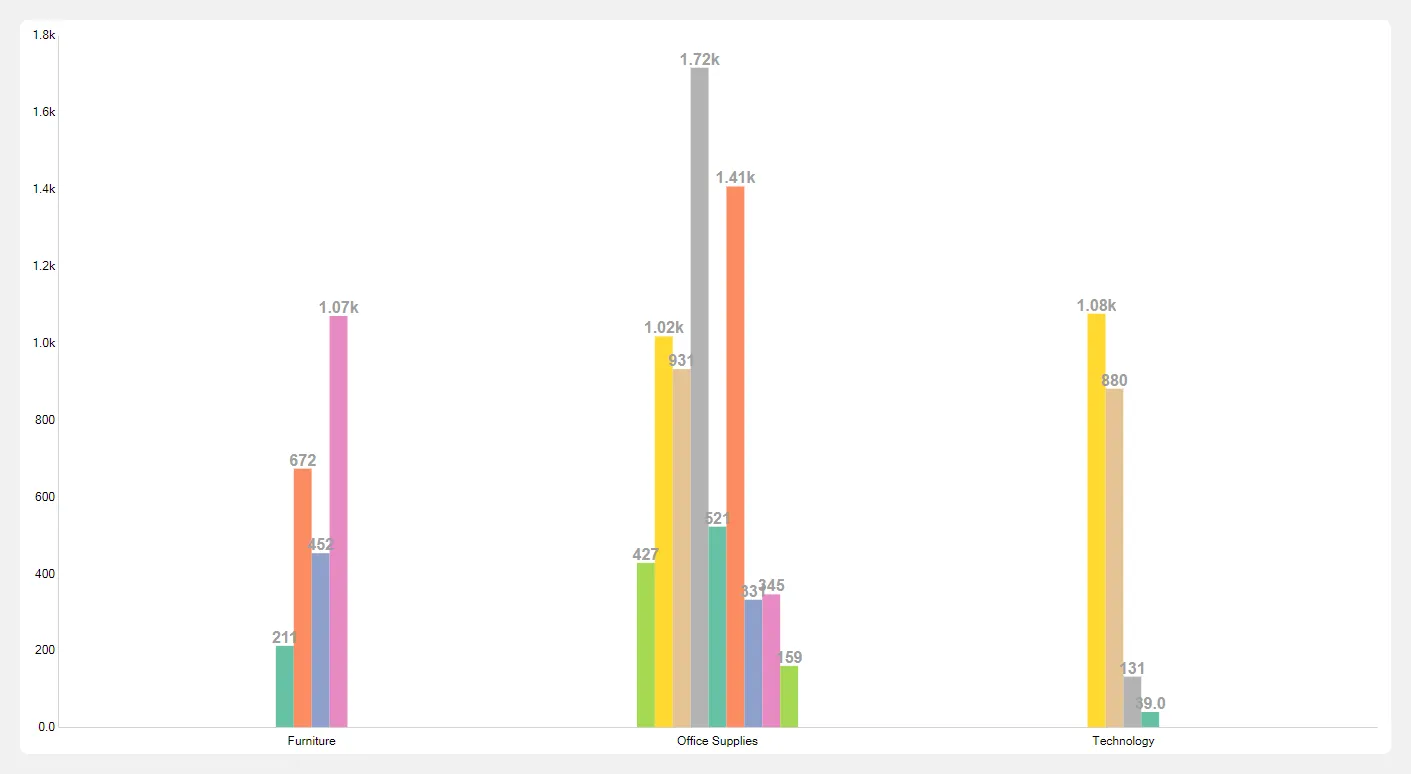
A Grouped Column Chart (also known as a clustered column chart) is a type of bar chart where multiple sets of data are displayed side-by-side in groups for easy comparison. In this chart, vertical bars (columns) represent data values, and each group consists of more than one column, allowing for the comparison of different categories across multiple dimensions.
Steps to create grouped column chart
Section titled “Steps to create grouped column chart”- Select the Grouped column chart from the list of available charts.
- Drag and drop either two categorical or a date and categorical field into the X-Axis drop zone.
- Drag and drop a numerical field into the Y-Axis drop zone.
- Click the Get Result button to generate the chart.