Heatmap
A heat map is a data visualization technique that uses color coding to represent values in a two-dimensional space, effectively displaying the magnitude of data points across a matrix or grid. It helps to visualize complex data sets and identify patterns, correlations, and trends at a glance.
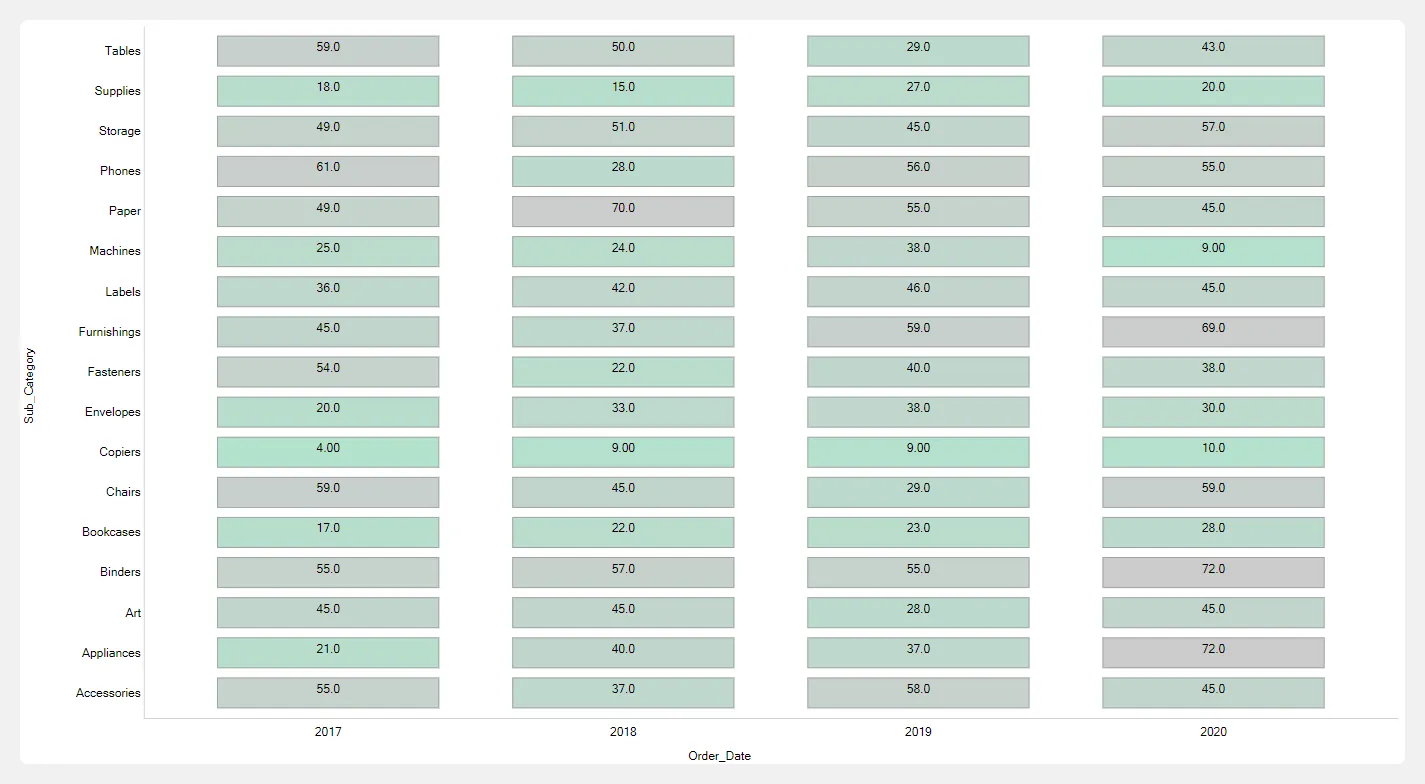
Steps to create heatmap
Section titled “Steps to create heatmap”- Select the Heatmap chart from the list of available charts.
- Drag and drop a categorical or date field into the X-Axis and Y-Axis drop zone.
- Drag and drop a numerical field into the Color By drop zone.
- Click the Get Result button to generate the chart.