Multi Line Chart
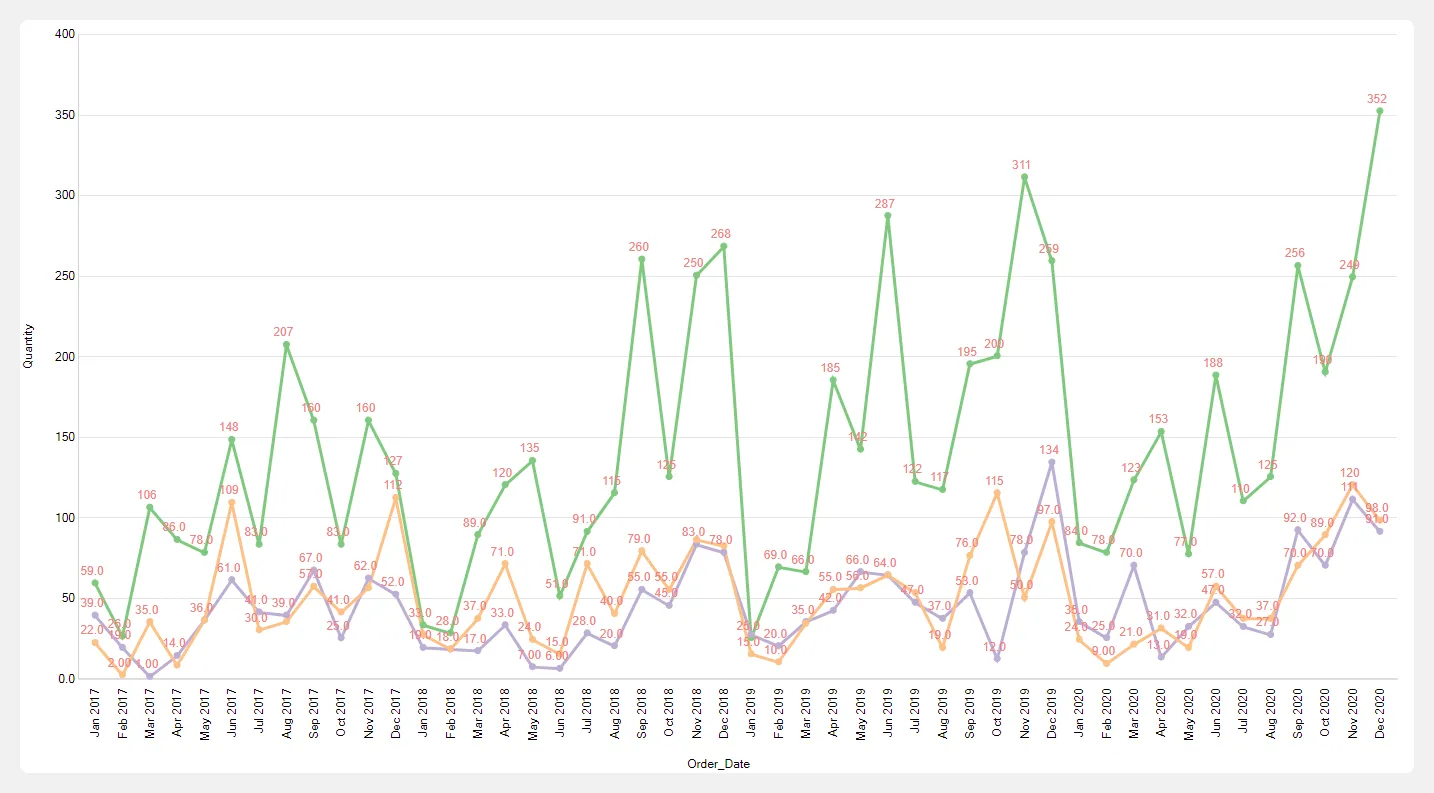
A Multi Line Chart (or Multiple Line Chart) is a type of data visualization that displays multiple data series on the same chart using separate lines for each series. This allows for easy comparison of trends and values across different categories or groups over a continuous range, often time.
Steps to create multi line chart
Section titled “Steps to create multi line chart”- Select the Column chart from the list of available charts.
- Drag and drop a categorical or date field into the X-Axis drop zone.
- Drag and drop a numerical field into the Y-Axis drop zone.
- Drag and drop categorical or a date field into the Color By in chart properties
- Click the Get Result button to generate the chart.