Radar Chart
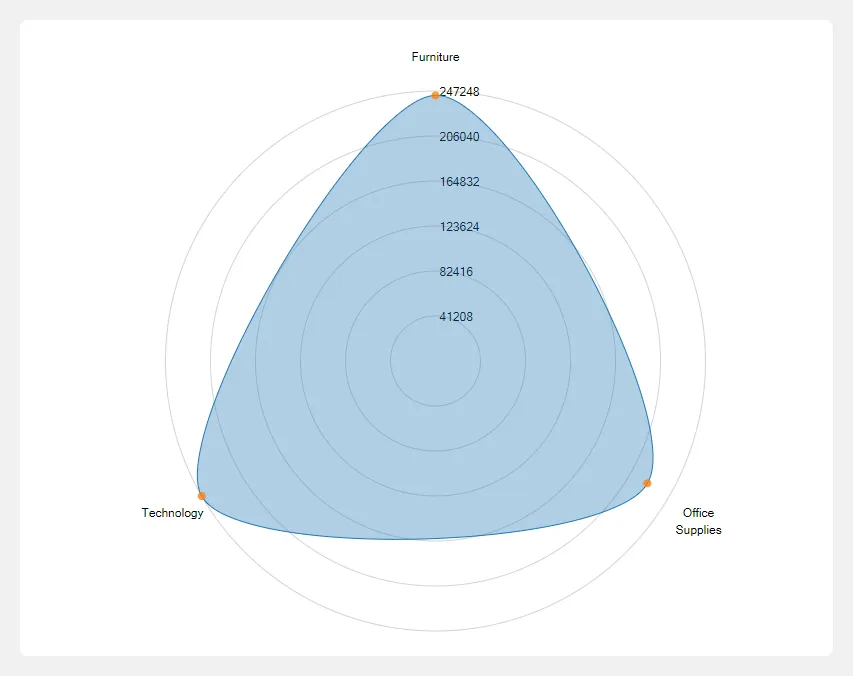
A radar chart (also known as a spider chart or web chart) is a type of data visualization that displays multivariate data in the form of a two-dimensional chart. It consists of a circular grid with multiple axes radiating from a central point, where each axis represents a different variable. The data points for each variable are plotted along these axes, and a line connects them, creating a polygonal shape.
Steps to create radar chart
Section titled “Steps to create radar chart”- Select the Radar chart from the list of available charts.
- Drag and drop a categorical or date field into the categorical drop zone.
- Drag and drop a numerical field into the numerical drop zone.
- Click the Get Result button to generate the chart.