Stacked Area Chart
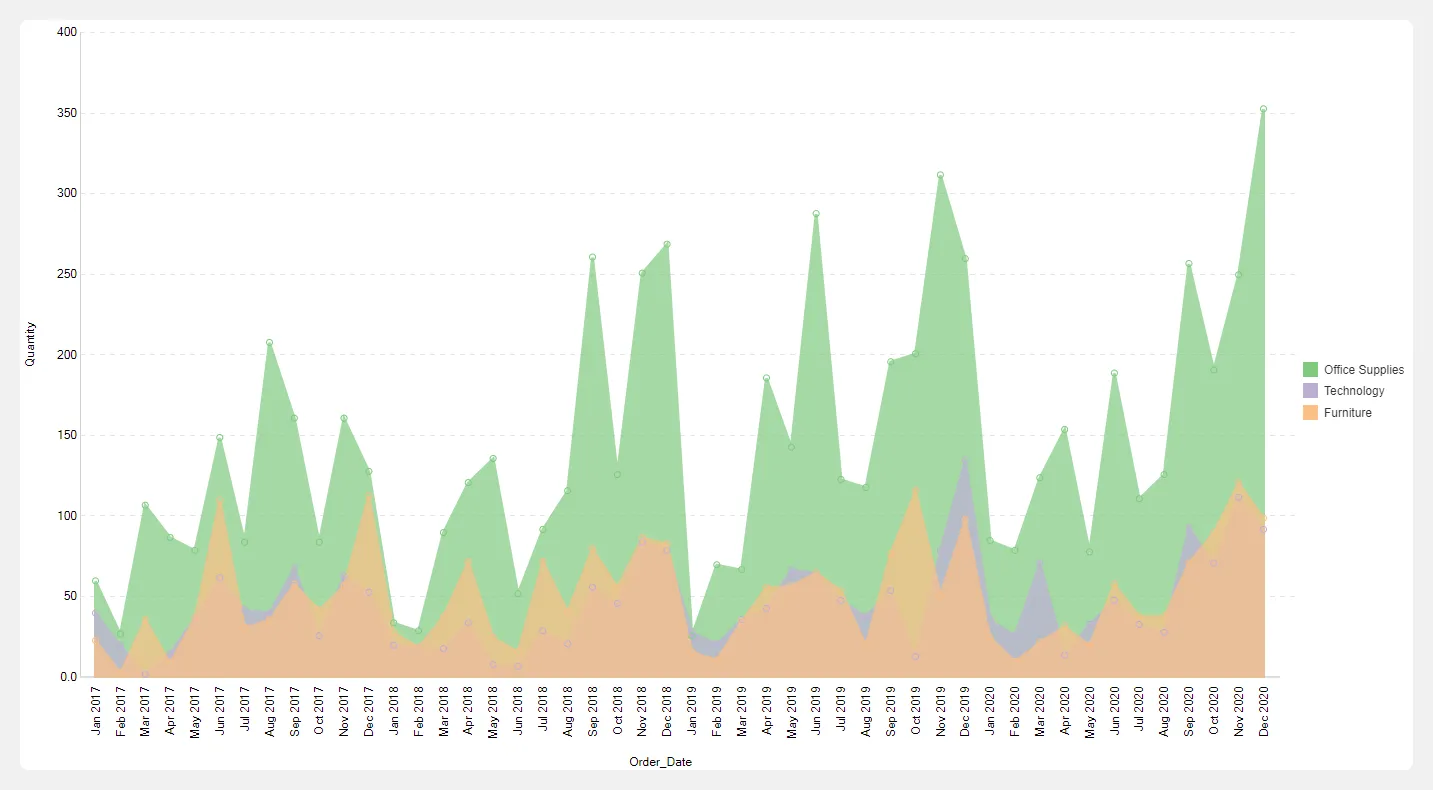
A Stacked Area Chart is a variation of an area chart where multiple data series are plotted on top of each other, with the area below each line filled in, and stacked vertically. The stacking allows viewers to compare both individual and cumulative values over time or across categories. It highlights how different components contribute to the whole and how their contributions change over time.
Steps to create stacked area chart
Section titled “Steps to create stacked area chart”- Select Stacked area chart from the list of available charts.
- Drag and drop either a categorical or a date field into the X-Axis drop zone.
- Drag and drop numerical field into the Y-Axis drop zone.
- Drag and drop a categorical or a date field into the Color By drop zone.
- Click the Get Result button to generate the chart.