Stacked Column Chart
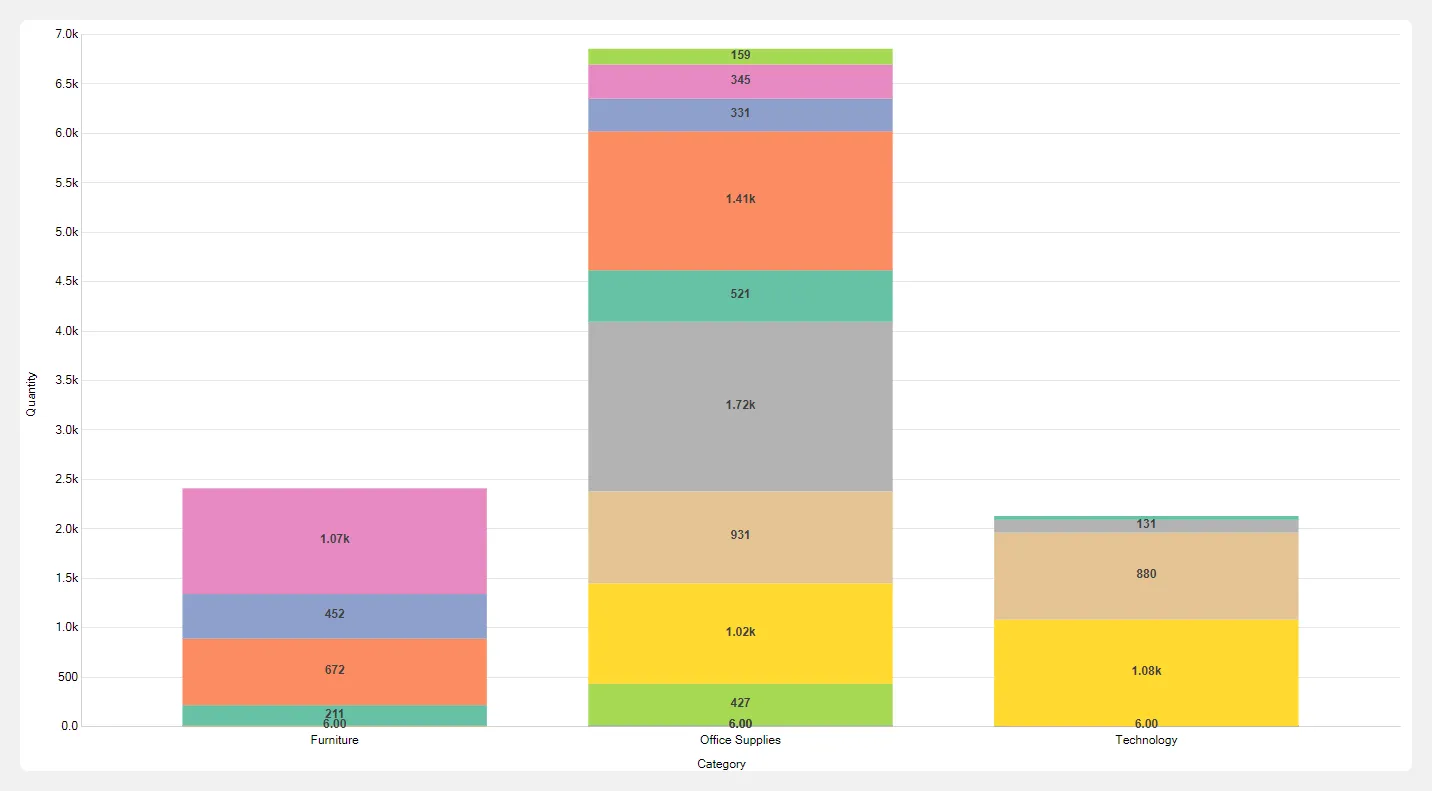
A Stacked Column Chart is a variation of a column chart where the vertical bars are divided into segments that represent different data series. Each bar represents a whole category, and the segments within the bar show the contribution of each subcategory or data series to the total. The height of each segment corresponds to its value, and the total height of the bar reflects the overall total for that category.
Steps to create stacked column chart
Section titled “Steps to create stacked column chart”- Select Stacked area chart from the list of available charts.
- Drag and drop either a categorical or a date field into the X-Axis drop zone.
- Drag and drop numerical field into the Y-Axis drop zone.
- Drag and drop a categorical or a date field into the Color By drop zone.
- Click the Get Result button to generate the chart.