Sunburst Chart
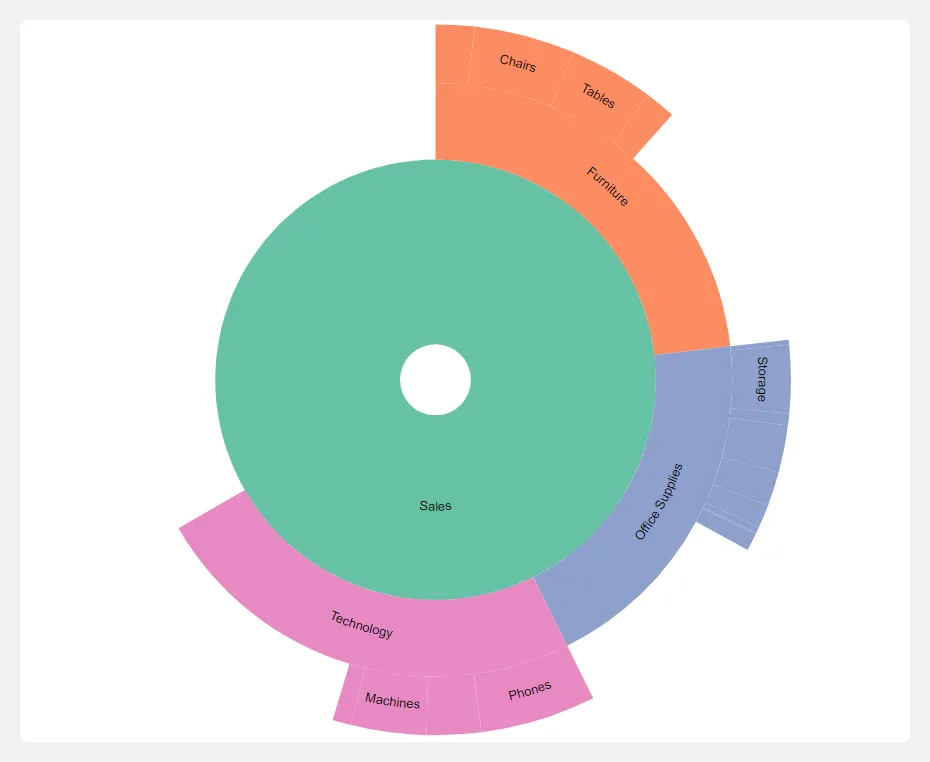
A sunburst chart is a hierarchical data visualization technique that displays data in a circular format, allowing users to understand the structure and relationships of data across multiple levels of hierarchy. It effectively represents parts of a whole, where each level of hierarchy is represented by a concentric circle, and each segment within these circles corresponds to a category or subcategory.
Steps to create sunburst chart
Section titled “Steps to create sunburst chart”- Select the Sunburst chart from the list of available charts.
- Drag and drop a categorical or date field into the categorical drop zone.
- Drag and drop a numerical field into the numerical drop zone.
- Click the Get Result button to generate the chart.