Table
In reporting, a table is a structured format used to organize and present data in a grid-like format, consisting of rows and columns. Tables are essential tools for summarizing, displaying, and analyzing data, making it easier for viewers to interpret information quickly and accurately.
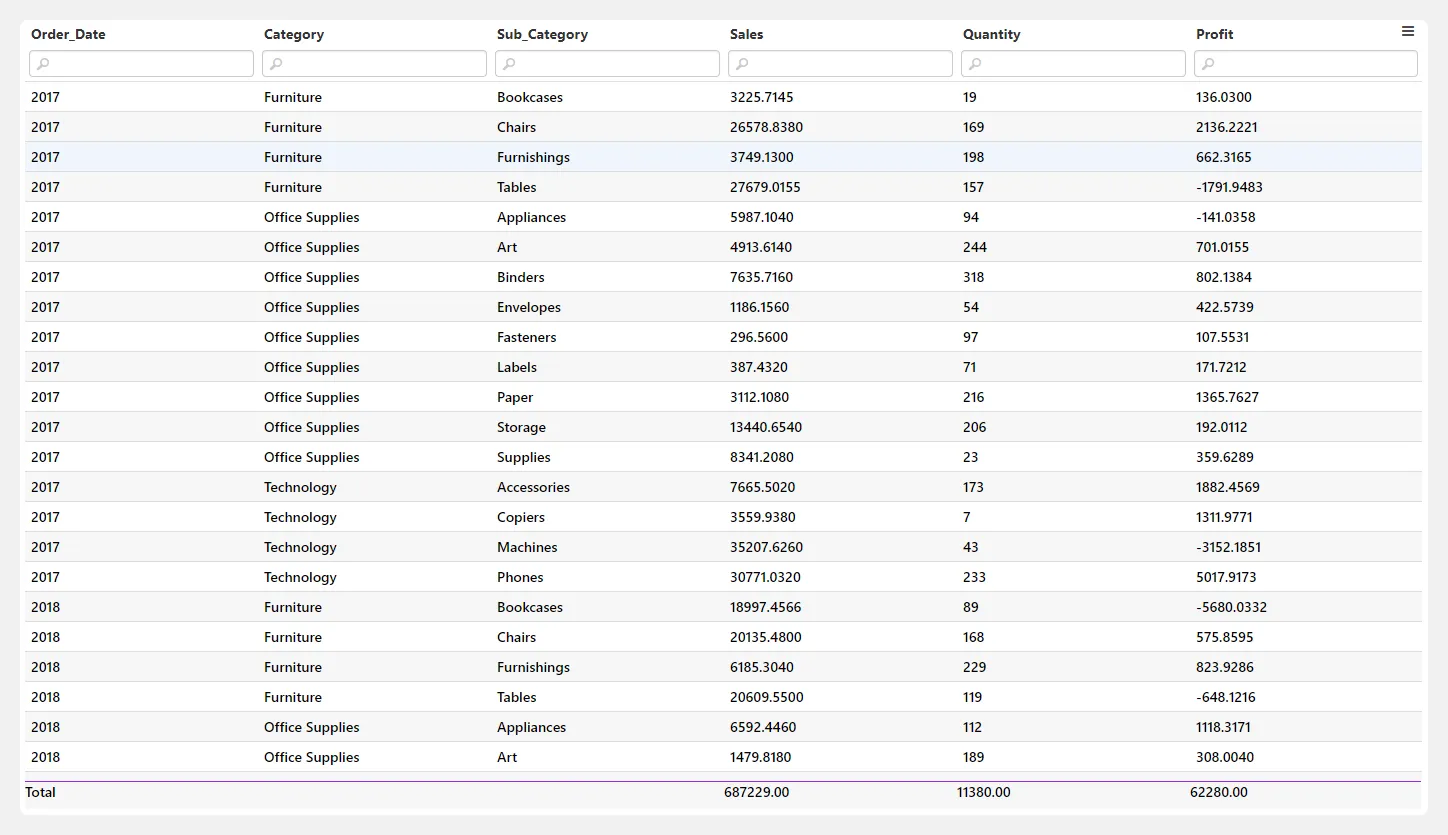
Steps to create table
Section titled “Steps to create table”- Select Table from the list of available charts.
- Drag and drop categorical or date fields and numerical fields into the columns drop zone.
- Click the Get Result button to generate the table.