Tree Chart
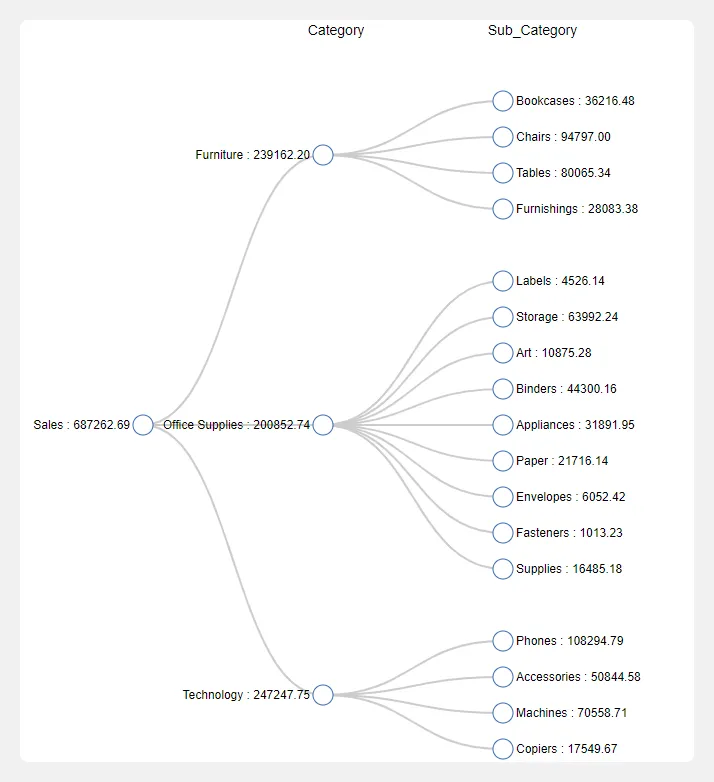
A tree chart (or tree diagram) is a type of data visualization that represents hierarchical structures in a branching format. It is particularly useful for displaying data that has multiple levels of categories or subcategories, allowing viewers to see relationships and the hierarchy within the data.
Steps to create tree chart
Section titled “Steps to create tree chart”- Select the Tree chart from the list of available charts.
- Drag and drop a categorical or date field into the categorical drop zone.
- Drag and drop a numerical field into the numerical drop zone.
- Click the Get Result button to generate the chart.