Waterfall Chart
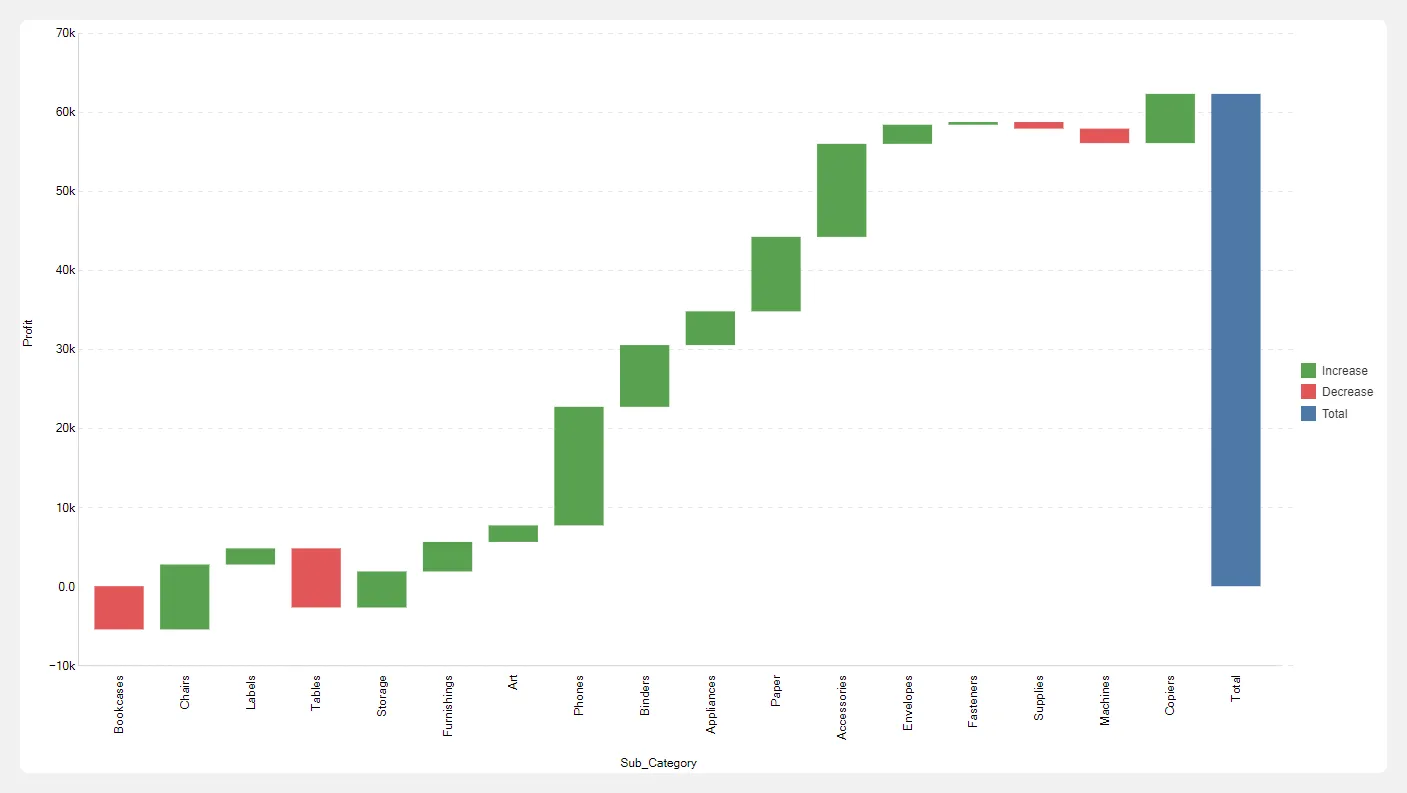
A waterfall chart is a type of data visualization that illustrates how an initial value is affected by a series of positive or negative values, leading to a final result. It visually breaks down the cumulative effect of sequentially introduced positive or negative values, making it particularly useful for understanding how a value changes over time or through a process.
Steps to create waterfall chart
Section titled “Steps to create waterfall chart”- Select the Waterfall chart from the list of available charts.
- Drag and drop a categorical or date field into the X-Axisdrop zone.
- Drag and drop a numerical field into the Y-Axis drop zone.
- Click the Get Result button to generate the chart.