Gauge Chart
A gauge chart (also known as a speedometer chart or dial chart) is a type of data visualization used to represent a single value in relation to a specified range of values. It typically displays this information using a dial or needle that points to a value on a curved or semi-circular scale, resembling a speedometer in a vehicle.
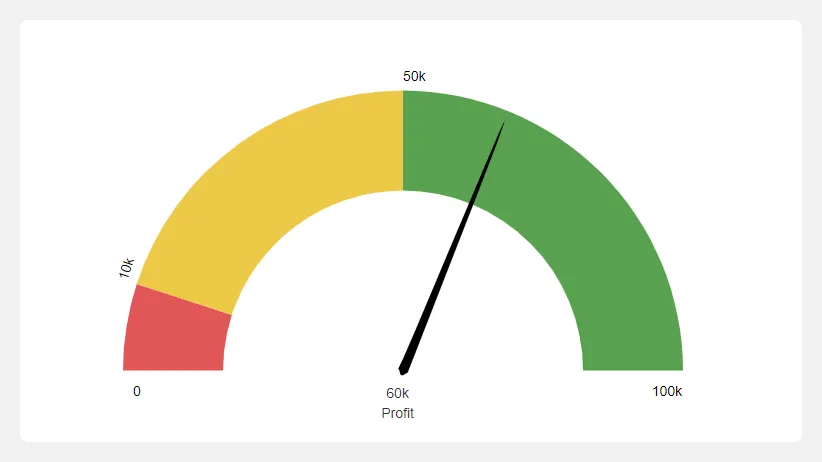
Steps to create gauge chart
Section titled “Steps to create gauge chart”- Select the Gauge chart from the list of available charts.
- Drag and drop either numerical field onto Pointer/Actual drop zone
- Enter threshold values in Max/Green, Yellow and Red input fields
- enter the values that would represent acceptable, warning, and critical
- Click on Get Result button