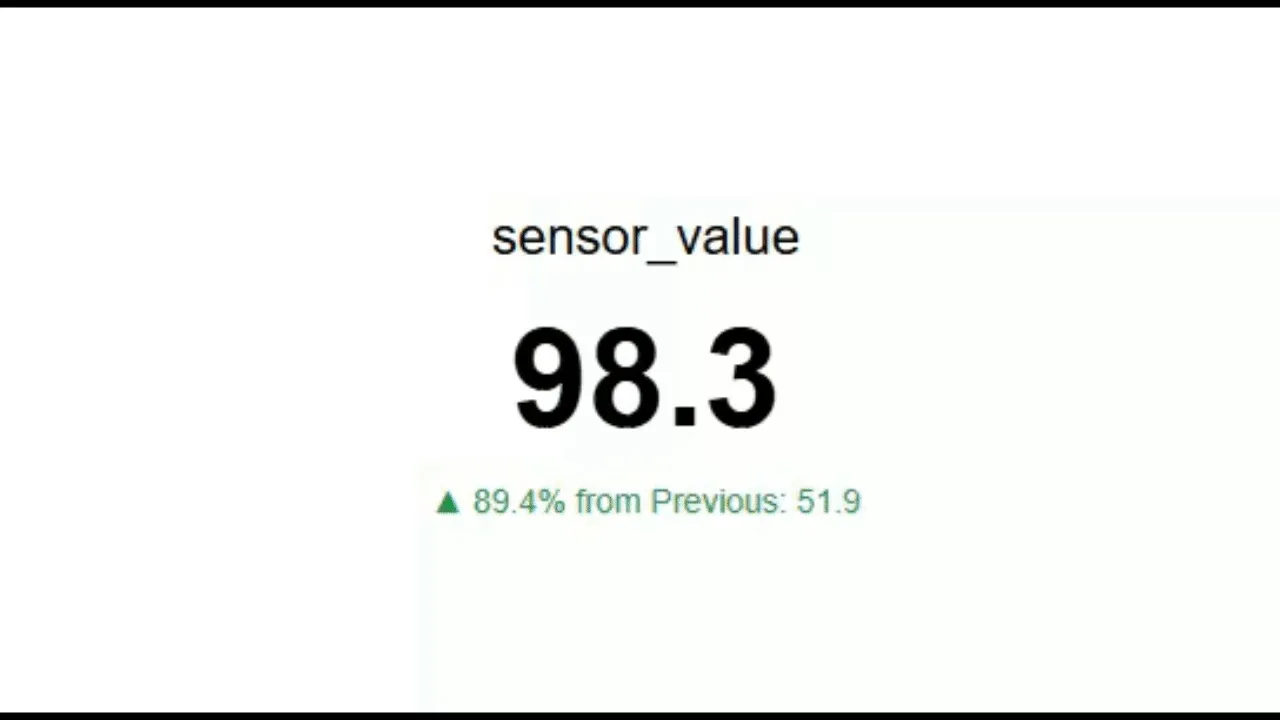
KPI
KPI stands for Key Performance Indicator. In the context of data visuals, KPIs are quantifiable metrics that organizations use to evaluate their success in achieving specific objectives. KPIs provide valuable insights into performance and help stakeholders make informed decisions.
Steps to create KPI
Section titled “Steps to create KPI”- Select the KPI chart from the list of available charts.
- Drag and drop a numerical field into the values drop zone.
- Click the Get Result button to generate the chart.