Catalog Explorer
The Catalog Explorer is a powerful feature within Grafieks that enables users to easily discover, manage, and enrich their data assets. With an intuitive interface, users can browse comprehensive metadata, view field-level details, and maintain data quality by updating data types and adding meaningful descriptions. This centralized metadata management capability improves data governance, enhances data discoverability, and ensures consistency across reports and dashboards. By allowing users to document and standardize their datasets, the Catalog Explorer helps teams make more informed, data-driven decisions while reducing ambiguity and improving collaboration across the organization.
About Metadata
Section titled “About Metadata”Metadata is the data that provides information about your data. It’s essentially “data about data,” describing the properties, context, or structure of the data it relates to. Metadata helps with organizing, understanding, finding, and managing data more effectively. The current version of Grafieks consists Descriptive Metadata along with option to update the “Grafieks Display Name”, “Grafieks Data Type” and “Description”.
Note: Only an administrator or datasource creator can update metadata.
1. Grafieks Display Name
Section titled “1. Grafieks Display Name”At times, the original field name may be unclear or overly technical, making it difficult to grasp the data’s purpose. Renaming the field to something more descriptive improves understanding and makes the content more accessible to others.
In Grafieks, the ‘Grafieks Display Name’ feature allows you to assign an alternate name or alias to a field from the source. When you double click on a cell, it will give you a text field option.
In future versions of Grafieks, this alternate name will be shown in data panes, providing a more intuitive and user-friendly experience.
2. Grafieks Data Type
Section titled “2. Grafieks Data Type”Converting a numerical field to a categorical field is often necessary in data analysis and reporting when the context of the analysis changes. Numerical and categorical field are treated differently in analytical tools, with numerical data representing quantitative data used for calculations and categorical data representing qualitative or categorical data used to segment or group data.
In Grafieks, you can convert the data type between categorical and numerical from the metadata column “Converted Data Type”. When you double click on a cell, it will give you a drop down option.
Few use cases of converting data type:
- Categorizing or Grouping Data
- Facilitating Comparative Analysis
- Enabling Drill-Downs and Hierarchies
- Handling Discrete Values Instead of Continuous Ones
3. Description
Section titled “3. Description”The description explains what the data represents, its source, and its context. Without a proper description, users may misunderstand the meaning of the data, leading to incorrect analyses or decisions. For example, describing a field as “Customer_Age” clarifies that it refers to customer demographics rather than a system-generated value. Similarly, for date fields, a clear description can specify whether the value represents “Order Date,” “Delivery Date,” or “Invoice Date.” This level of detail reduces errors and ensures the data is interpreted and used correctly. Well-defined descriptions also help AI to understand the dataset, providing improved context and clarity for automated insights, recommendations, and data processing.
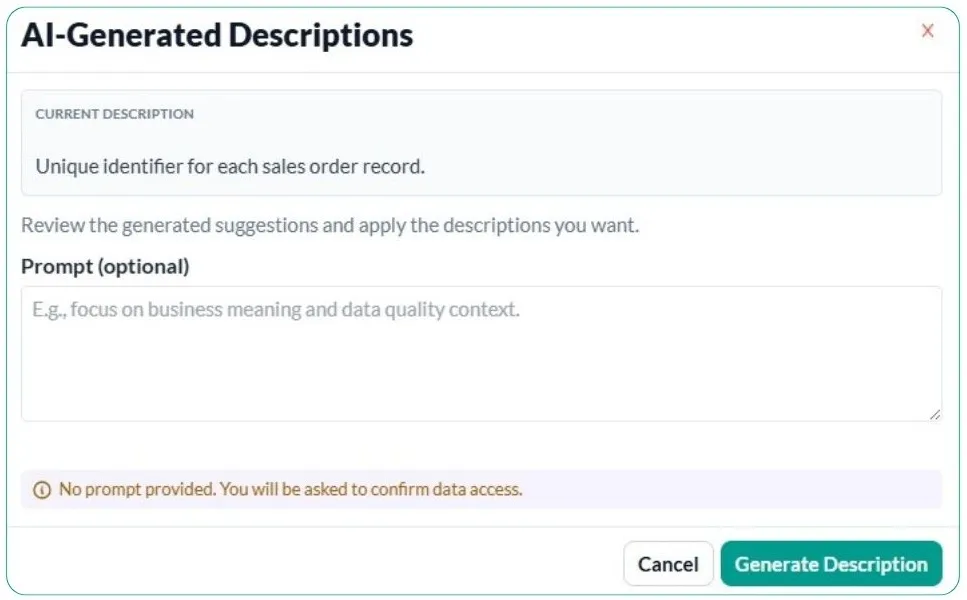
In Grafieks, users can add or update field descriptions directly from the metadata column labeled “Description.” By double-clicking on a cell, a text input field appears, allowing quick and easy edits. Additionally, Grafieks offers an AI-assisted description feature that automatically generates suggested descriptions for fields based on data patterns and context. This helps users save time, maintain consistency, and improve overall data documentation quality, especially when working with large or complex datasets.
Steps to add or generate description:
- Navigate to datasource from the menu.
- Metadata tab will be selected by default.
- In the last column of the table, click on Edit icon.
- Add description manually or
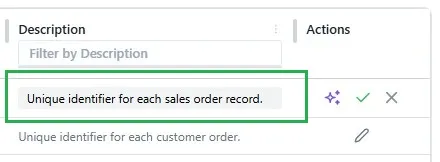
- Take help from AI by clicking on purple colored icon
Note: If no prompt is provided, the system will request your confirmation before allowing AI to access the data. This step ensures transparency and gives you full control over how your data is used, helping to protect sensitive information and maintain compliance with data governance and privacy standards.