Dashboard filter for real-time report
This filter applies to reports generated using real-time data.
There are two types of filter for real-time report.
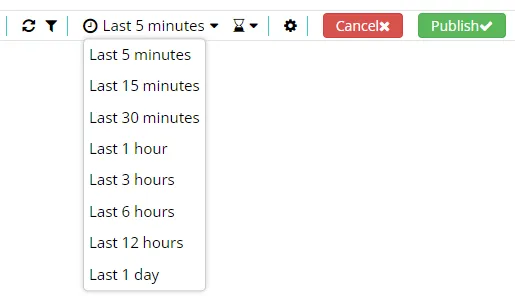
1. Time Range: With this filter, you can set the time frame to be plotted onto the time series chart.
In the current version, a user can select as small as 5 mins range or a max range of 1 day.
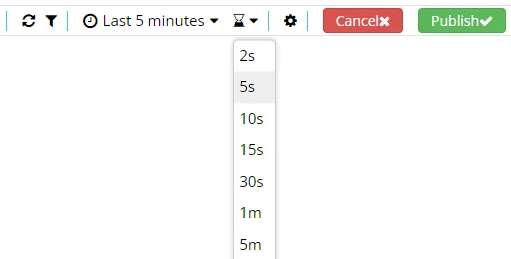
2. Interval: This filter allows user to set the refresh time for real-time data.
Grafieks has a minimum interval option on refresh settings with the default value of 2s , this means regardless of how small the time frame is received, data points will not be less than 2s apart.
**Recomendation:** A lower limit for the interval is `2s` but we recommend Interval to be set to write frequency, for example 1 min if your data is written every minute.